


Service Management: VPS Graphs
The Graphs section in the Hipposerve® vPanel provides a visual overview of your VPS network activity. These graphs display the amount of data sent and received by your server over time.
This information can be useful for a number of reasons, including:
- Monitoring traffic usage to see how much network activity your VPS is generating.
- Troubleshooting performance issues where unusually high traffic may indicate a configuration issue, software problem, or excessive load.
- Detecting unusual activity such as unexpected spikes that could indicate abuse, misconfigured services, or potential compromise.
- Understanding usage patterns to help plan capacity or determine when your server is most active.
The graphs provide a quick visual reference, allowing you to monitor your server's network behaviour without needing to log into the operating system or run command-line monitoring tools.
Accessing the Graphs
- Open your VPS in the Hipposerve® Portal (see here).
- In Service Management, click the Graphs icon.
Once opened, the graphs will display the amount of network data sent and received by your VPS.
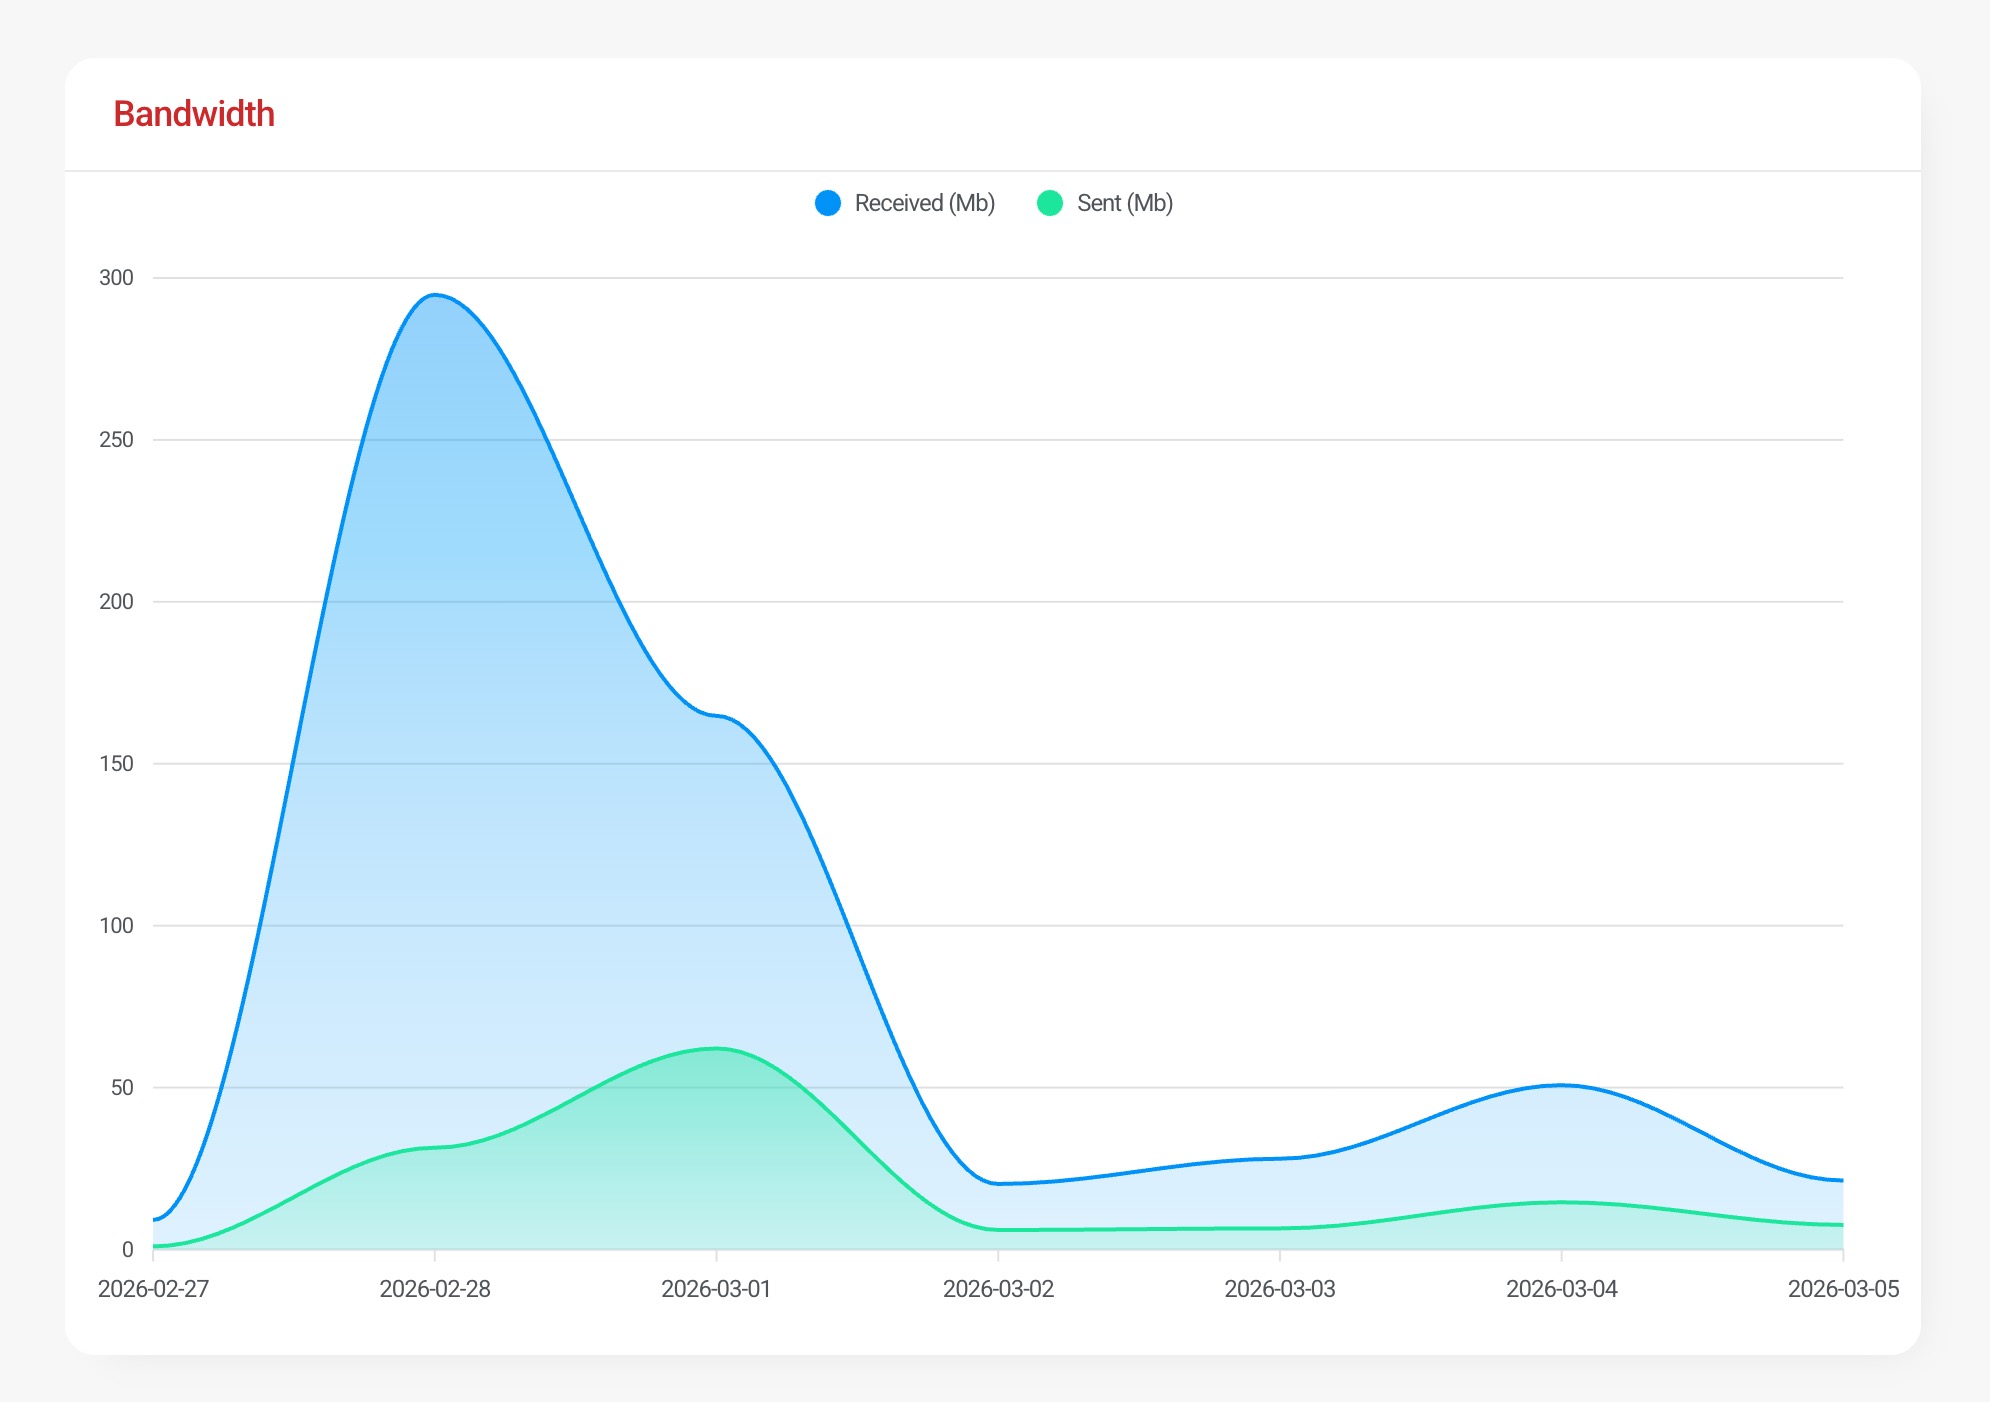
This allows you to quickly review your server's recent traffic activity and identify any unusual behaviour.


